Basic Examples (1)
Basic Examples
(1)
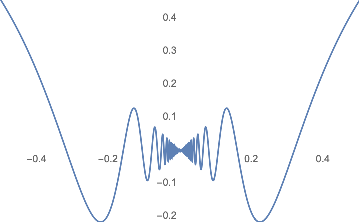
Click and drag to select regions of a plot that you wish to see enlarged. Single-click to reset the zoom area:
In[1]:=
Out[1]=
Scope (1)
Scope
(1)
Options (1)
Options
(1)
Possible Issues (2)
Possible Issues
(2)