Basic Examples

Retrieve the ResourceObject:
ResourceObject["Museum of Modern Art Holdings and Artists"]
ResourceObject
Name: Museum of Modern Art Holdings and Artists
Type: DataResource
Description: Holdings and artists of The Museum of Modern Art

View the data:
ResourceData["Museum of Modern Art Holdings and Artists"]
EntityStore

Types:
MoMAHolding
MoMAArtist
Entity count:
116886
13102
Property count:
26
8

Register the EntityStore:
EntityRegister[ResourceData["Museum of Modern Art Holdings and Artists"]]

EntityStore

Types:
MoMAHolding
MoMAArtist
Entity count:
116886
13102
Property count:
26
8


Retrieve random entities:
RandomEntity[#,5]&/@{"MoMAHolding","MoMAArtist"}

ZMA GANIA
,
Françoise with a Bow in Her Hair (Françoise au Noeud dans les Cheveux)
,
Two Girls in Matching Suits, Coney Island, New York
,
Vaudeville
,
Democracy is Merry (Demokratie ist lustig)
,
John Harvey
,
Elena Borstein
,
Arsen Anton Ostojic
,
James Hamilton
,
Peter Jackson

View a list of properties:
EntityProperties/@{"MoMAHolding","MoMAArtist"}

label
,
title
,
artist(s)
,
start date
,
completion date
,
media
,
area
,
aspect ratio
,
circumference
,
depth
,
diagonal
,
diameter
,
duration
,
height
,
length
,
seat height
,
weight
,
width
,
accession number
,
acquisition date
,
cataloged
,
classification
,
credit line
,
object ID
,
URL
,
thumbnail URL
,
label
,
name
,
Wolfram person data
,
date of birth
,
date of death
,
gender
,
nationality
,
MoMA pieces


Visualization

Make a date histogram of the completion dates of all works at MoMA:
DateHistogram[DeleteMissing[EntityValue["MoMAHolding","CompletionDate"]]]
1660
1720
1780
1840
1900
1960
2020
0
5000
10000
15000
20000
25000
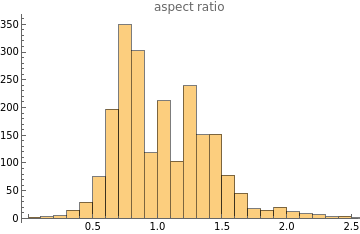
Plot histograms of painting aspect ratios and areas:
Table[Histogram[EntityValue[EntityClass["MoMAHolding",{EntityProperty["MoMAHolding","Classification"]"Painting"}],prop],PlotLabelprop],{prop,{EntityProperty["MoMAHolding","AspectRatio"],EntityProperty["MoMAHolding","Area"]}}]

,
0
20000
40000
60000
80000
0
100
200
300
400
500
600
700
area
