Basic Examples
(
2
)
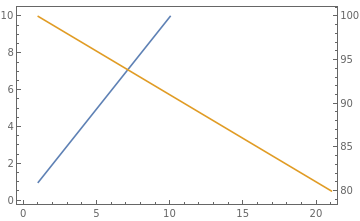
Plot two datasets together but with different
y
-axes:
I
n
[
1
]
:
=
[
◼
]
M
u
l
t
i
p
l
e
A
x
e
s
L
i
s
t
P
l
o
t
[
{
R
a
n
g
e
[
1
0
]
,
R
a
n
g
e
[
1
0
0
,
8
0
,
-
1
]
}
,
J
o
i
n
e
d
T
r
u
e
]
O
u
t
[
1
]
=
—
—
—
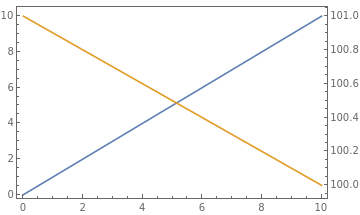
Data can be a one-dimensional list or pairs of
{
x
,
y
}
-values:
I
n
[
1
]
:
=
[
◼
]
M
u
l
t
i
p
l
e
A
x
e
s
L
i
s
t
P
l
o
t
[
{
{
{
0
,
0
}
,
{
1
0
,
1
0
}
}
,
{
{
0
,
1
0
1
}
,
{
1
0
,
1
0
0
}
}
}
,
J
o
i
n
e
d
T
r
u
e
]
O
u
t
[
1
]
=
O
p
t
i
o
n
s
(
3
)