Basic Examples (3)
Basic Examples
(3)
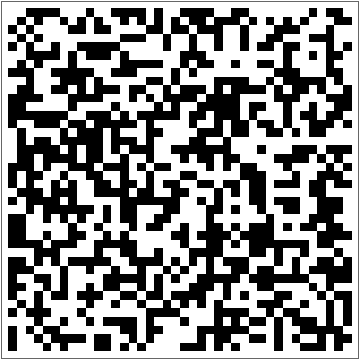
Evolution with 50% of black cells:
ArrayPlot[40,50,100]
———
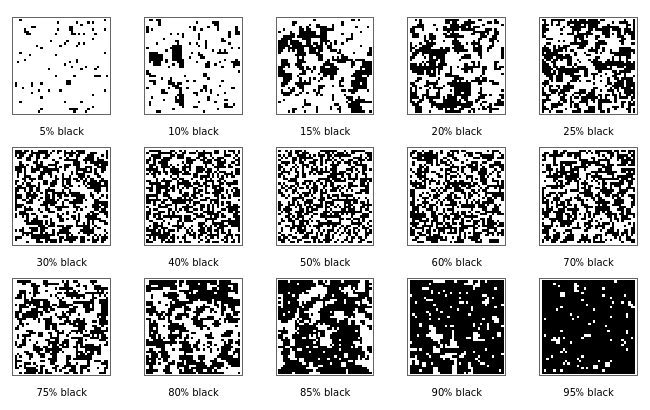
Configurations generated after 50 steps from various initial densities:
GraphicsGridPartitionTableLabeledArrayPlot[40,p,50],ImageSize{100,110},IntegerString[p]<>"% black",{p,{5,10,15,20,25,30,40,50,60,70,75,80,85,90,95}},5,ImageSize{650,410}
———
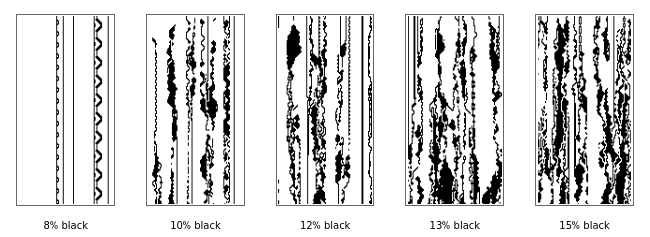
Slices through their evolution:
GraphicsRowTableLabeledArrayPlot[100,p,200,2],ImageSize{100,210},IntegerString[p]<>"% black",{p,{8,10,12,13,15}},0,AspectRatio0.45,ImageSize650