Basic Examples
Basic Examples
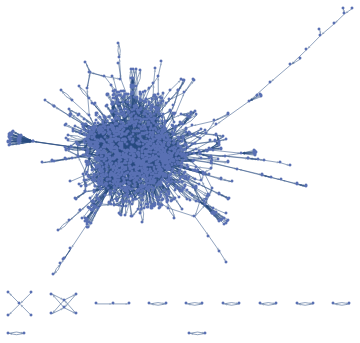
Retrieve the graph:
In[]:=
ResourceData["Haemophilus Influenzae Whole Network"]
Out[]=
Summary properties:
In[]:=
ResourceData["Haemophilus Influenzae Whole Network",All]["Summary"]
Out[]=
Name | Haemophilus Influenzae Whole Network |
VertexCount | 1988 |
EdgeCount | 4737 |
Description | Whole cellular network data |
ByteCount |
Basic Applications
Basic Applications
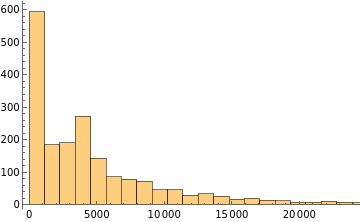
Create a histogram of the centrality:
In[]:=
g=ResourceData["Haemophilus Influenzae Whole Network"];
In[]:=
Histogram[BetweennessCentrality[g]]
Out[]=
Show a table of properties:
In[]:=
Dataset[Table[<|ii[g]|>,{i,{GraphReciprocity,GlobalClusteringCoefficient,GraphAssortativity}}]]
Out[]=