Basic Examples (5)
Basic Examples
(5)
Make a random signal:
In[1]:=
SeedRandom[23];n=200;randData=Transpose[{Range[n],RandomReal[{0,100.},n]}];
Compute with five knots for the probabilities and :
QuantileRegression
0.25
0.75
In[2]:=
qFuncs=[randData,5,{0.25,0.75}];
Here are the formulas of the obtained regression quantiles:
In[3]:=
Simplify/@Through[qFuncs[x]]
Out[3]=
,
|
|
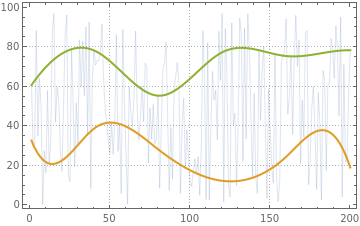
Here is a plot of the original data and the obtained regression quantiles:
In[4]:=
ListLinePlot[{randData,qFuncs〚1〛/@randData〚All,1〛,qFuncs〚2〛/@randData〚All,1〛},PlotLegends{"data",0.25`,0.75`},PlotStyle{Thin,Thick,Thick},PlotTheme"Detailed"]
Out[4]=
Find the fraction of the data points that are under the second regression quantile:
In[5]:=
Length[Select[randData,#〚2〛<qFuncs〚2〛[#〚1〛]&]]/Length[randData]//N
Out[5]=
0.75
The obtained fraction is close to the second probability, , given to .
0.75
QuantileRegression
Scope (3)
Scope
(3)
Options (2)
Options
(2)
Applications (18)
Applications
(18)
Properties and Relations (2)
Properties and Relations
(2)
Possible Issues (11)
Possible Issues
(11)
Neat Examples (1)
Neat Examples
(1)