Basic Examples (5)
Basic Examples
(5)
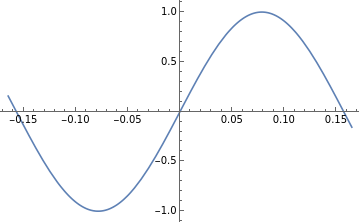
Suggest a plot range for a trigonometric function:
In[189]:=
func=Sin[20x];[func,x]
Out[190]=
{x,-0.164934,0.164934}
In[191]:=
Plot[func,%]
Out[191]=
———
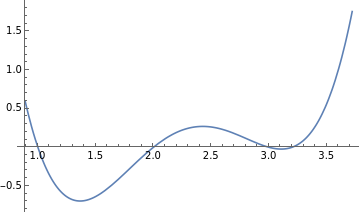
Suggest a plot range for a polynomial function:
In[192]:=
func=(x-1)(x-2)(x-3)(x-3.2);[func,x]
Out[193]=
{x,0.889746,3.72065}
In[194]:=
Plot[func,%]
Out[194]=
———
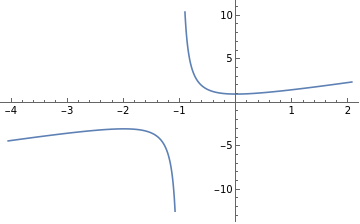
Suggest a plot range for a rational function:
In[195]:=
func=(x^2+x+1)/(x+1);[func,x]
Out[196]=
{x,-4.06,2.06}
In[197]:=
Plot[func,%]
Out[197]=
———
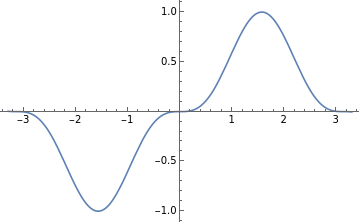
Suggest a plot range for a generic function:
In[198]:=
func=Sin[x]^3;[func,x]
Out[199]=
{x,-3.29867,3.29867}
In[200]:=
Plot[func,%]
Out[200]=
———
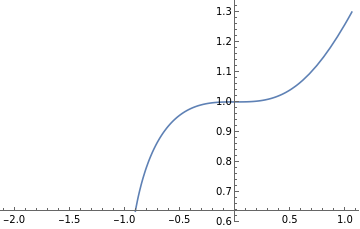
Suggest a plot range for another function:
In[201]:=
func=(x^3+1)^(1/3);[func,x]
Out[202]=
{x,-2.06,1.06}
In[203]:=
Plot[func,%]
Out[203]=
———
Options (2)
Options
(2)